A while back, I published an article that compared a high-quality Class-D amplifier with a low-quality “internet-brand” Class AB amp to prove a point about topology not being the deciding factor in performance and accuracy. The contrast in their performance was shocking, with the Class-D amp besting the AB in every way. An amateur YouTuber made a video breaking down the comparison. In his video, he stated that “the AB amp only made 0.187%” distortion and implied that this was a very small amount and was, consequently, irrelevant. Compared to speaker distortion, he was right – that is a small number. In the world of audio component quality, it’s atrocious for a CTA-2006 measurement. Let’s examine how percentage THD numbers are calculated and what they mean regarding clarity.
Amplifier Distortion Measurements
Known officially as ANSI/CTA-2006-D, the Testing and Measurement Methods for In-Vehicle Audio Amplifiers standard describes the process and test criteria to quantify the performance characteristics of car audio amplifiers. The CTA-2006-D standard describes Total Harmonic Distortion plus Noise as “the sum of the Total Harmonic Distortion and noise generated by the Power Amplifier. The percentage of Total Harmonic Distortion of a sine wave of the fundamental frequency, f, is numerically equal to the ratio of 100 times the square root of the sum of the squares of the RMS voltages of each of the individual harmonics to the RMS voltage of the fundamental, expressed as a percentage. THD+N is the ratio of a total output signal to the same signal with the fundamental tone removed, leaving only the noise and Harmonic Distortion components.”
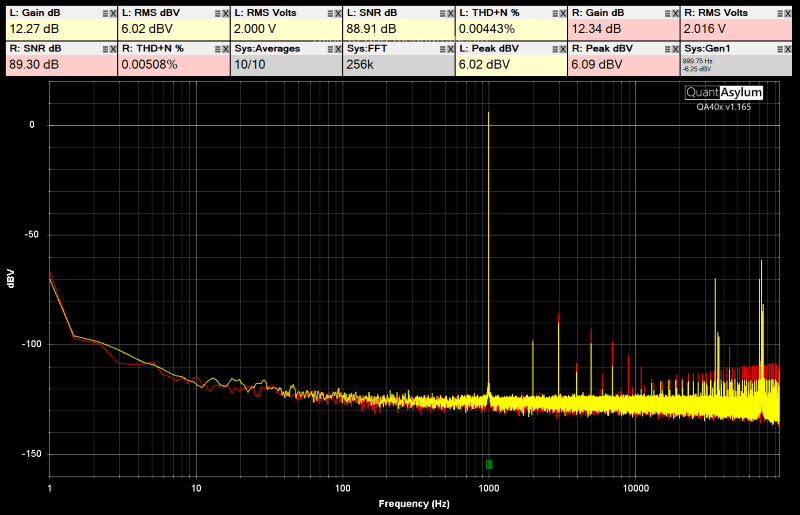
Allow me to explain that in terms that make more sense. To test an amplifier for total harmonic distortion plus noise (THD+N), I set the amplifier up in my lab and connect the output terminals to non-inductive load resistors. I then feed the amplifier with a single-frequency test tone. In most cases, for full-range amplifiers, the test tone is at 1 kHz. The output of the amplifier is adjusted to a desired level. In the case of my Test Drive Reviews and the CTA-2006-C standard, we use 1 watt into a 4-ohm load. This equates to 2 volts RMS of output on the speaker terminals.
The output of the amplifier is then evaluated in the frequency domain to see what distortion has been added to the signal.
Distortion Measurement Equipment
In order to accurately measure harmonic distortion, a high-resolution audio analyzer is required. The hardware standard for the audio industry (both home and car) is from Audio Precision. While their gear is excellent, it’s also extremely expensive. A good quality analyzer costs about $25,000, and there are yearly fees for their software. Sadly, that’s well out of my budget. I use a compact audio analyzer from a compact called QuantAsylum. I’ve owned their original QA401, and currently have a QA402 and a QA403. Priced at $600 USD, this audio analyzer is affordable to enthusiasts and offers more-than-adequate performance to characterize most consumer-grade audio components. Sadly, the QA403 hasn’t been available for almost a year because of component shortages.
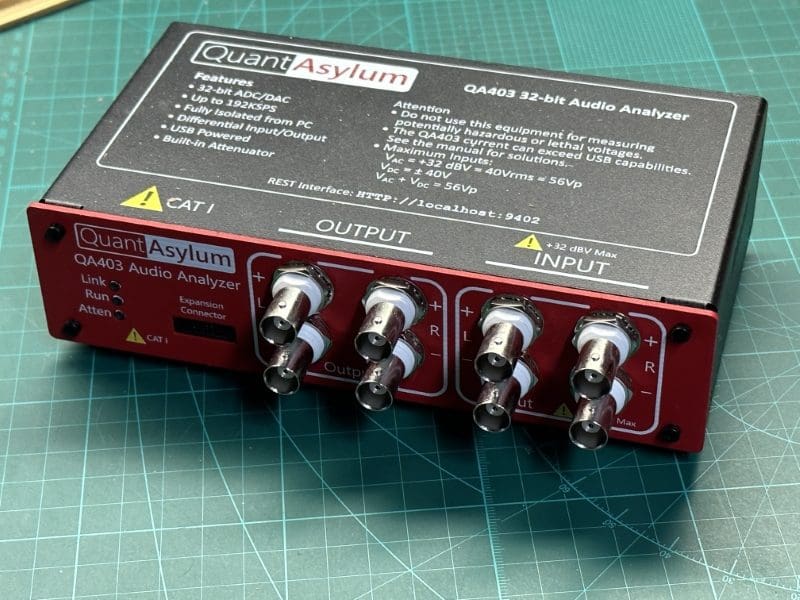
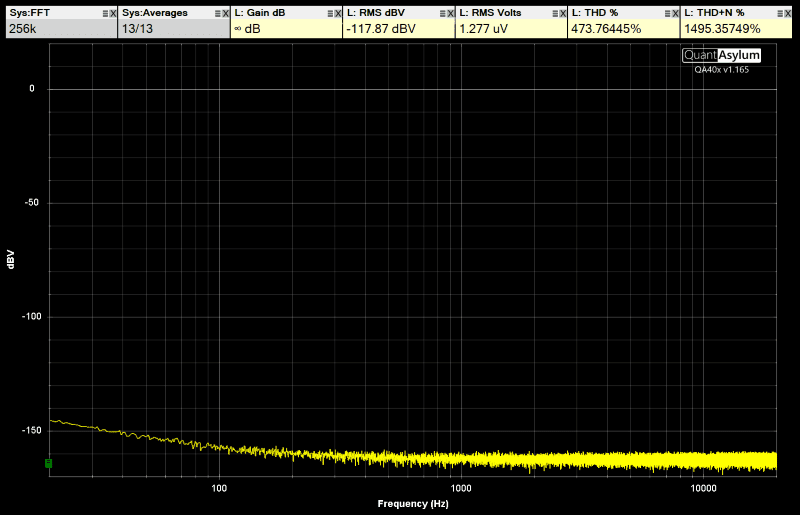
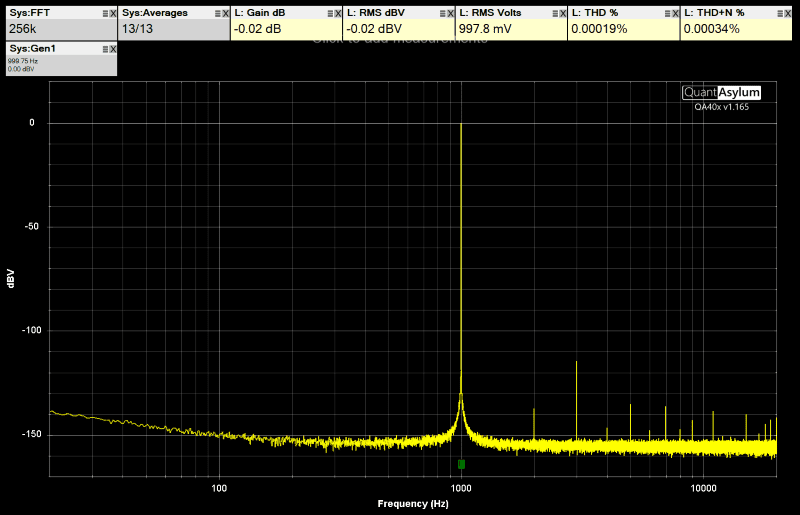
In the simplest of terms, these audio analyzers contain two key components: a low-noise function generator and a high-resolution spectrum analyzer. For their price, they offer impressive performance with a noise floor of 1.277 microvolts, a THD reference of 0.00019% and a THD+N reference of 0.00034%.
Relating Percentage Distortion to the Real World
So, what in the world does 0.00019% THD mean? We know it’s good because the number is very small, right? How is this value calculated? A better way to look at distortion is as an amplitude rather than a percentage. A level of 0.00019% is equivalent to an amplitude of -114.425 dB. But how is that calculated? I activated the marker feature in the QA software and selected all the peaks on the reference distortion level graph. The peaks represented by markers 1 through 6 represent harmonic distortion that was added by the amplifier. The software shows the absolute value of each peak in dBV and their relative value compared to the highest in dBr. In the case of our reference test signal, it is at a level of -0.02 dBV, or 997.8 millivolts. A level of 0 dBV is equal to 1 volt.
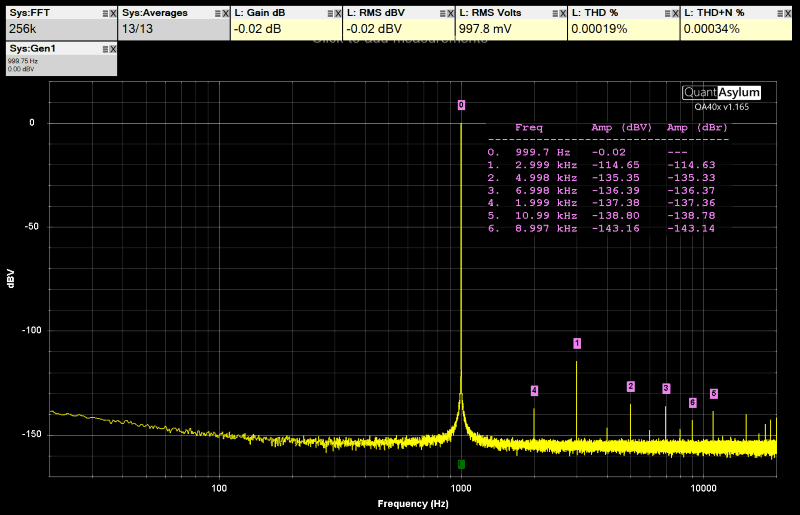
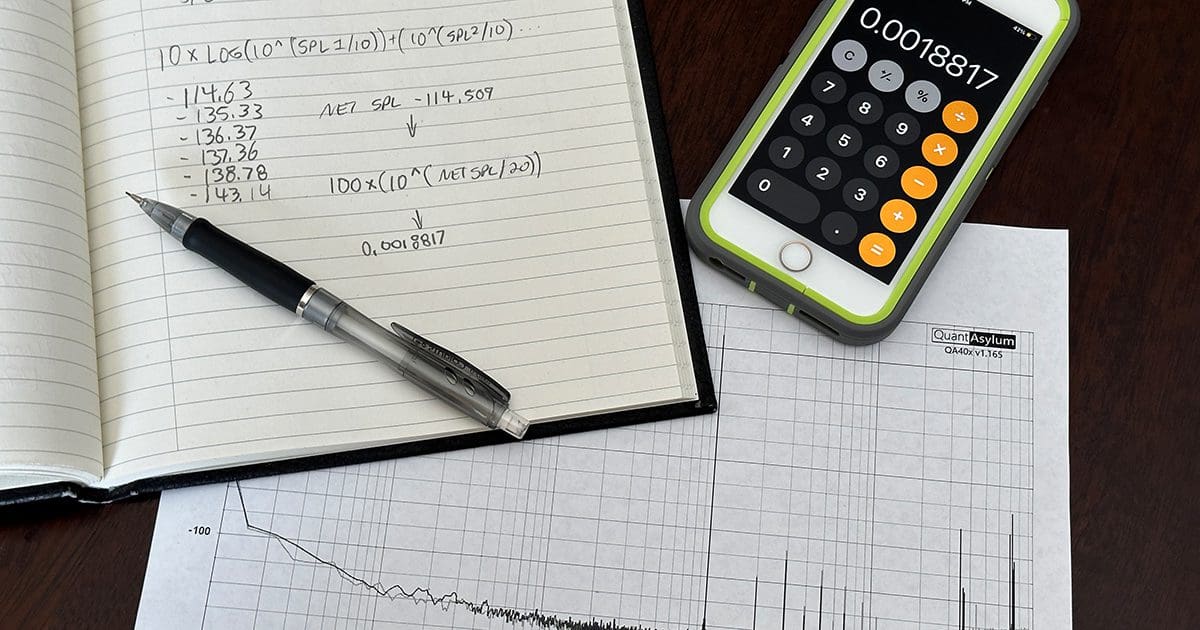
If we look at the second harmonic labeled with 1, we see it’s at 3 kHz and has an amplitude that’s 114.63 dB below our reference. If this were the only trace on the graph other than the fundamental, our THD would be -114.63 dB or 0.00018557%. However, it’s not. We must add the sum of all the harmonics to calculate the total harmonic distortion. Adding decibel values is best done in a spreadsheet as it requires several mathematical steps for each value. Our amplitudes of -114.63, -135.33, -136.67, -137.36, -138.78 and -143.14 add to a total level of -114.509. We can convert that to a percentage by raising 10 to the power of -114.509 and multiplying that number by 100 to get 0.00018817%. That’s close enough to our as-displayed 0.00019%.

A more important calculation is to convert a percentage distortion number back into an amplitude. This gives us an idea of how loud the unwanted harmonics are relative to the fundamental frequency.

Interpreting Distortion Measurements
Let’s go back to the data from the Class AB versus the Class D amplifier. The Class D amp had a worst-case THD+N measurement of 0.00384% in the left channel, and the Class AB amp was 0.1217% on its left channel. If we convert those percentages back to decibel values, we get -88.3 dB and -58.29 dB.
To convert those numbers into something more understandable, the Class D amp added harmonics that added up to -88 dB quieter than each fundamental audio frequency passed through the amplifier. If you listened to the amplifier at 88 dB SPL, the sum of the amplitude of all the distortion harmonics would be 0 dB SPL. That’s really, really quiet! On the other hand, if you had this particular Class AB amplifier in your audio system, the distortion harmonics would be at 30 dB SPL if you were listening at 88 dB SPL. If you turn the volume up to 100 dB SPL, now the noise from the Class AB is just below 40 dB SPL.
To put these volume levels into perspective, 0 dB SPL is equivalent to the sound a mosquito makes at a distance of 5 meters from a person. This is considered the lower threshold of human hearing but is NOT absolute silence. By contrast, 30 dB SPL is the average volume of a face-to-face conversation in a quiet whisper. Who in the world would want a piece of audio equipment to add multiples of every frequency passed through the device at an amplitude this high, especially from a product that claims to be great?
THD Numbers to Watch For
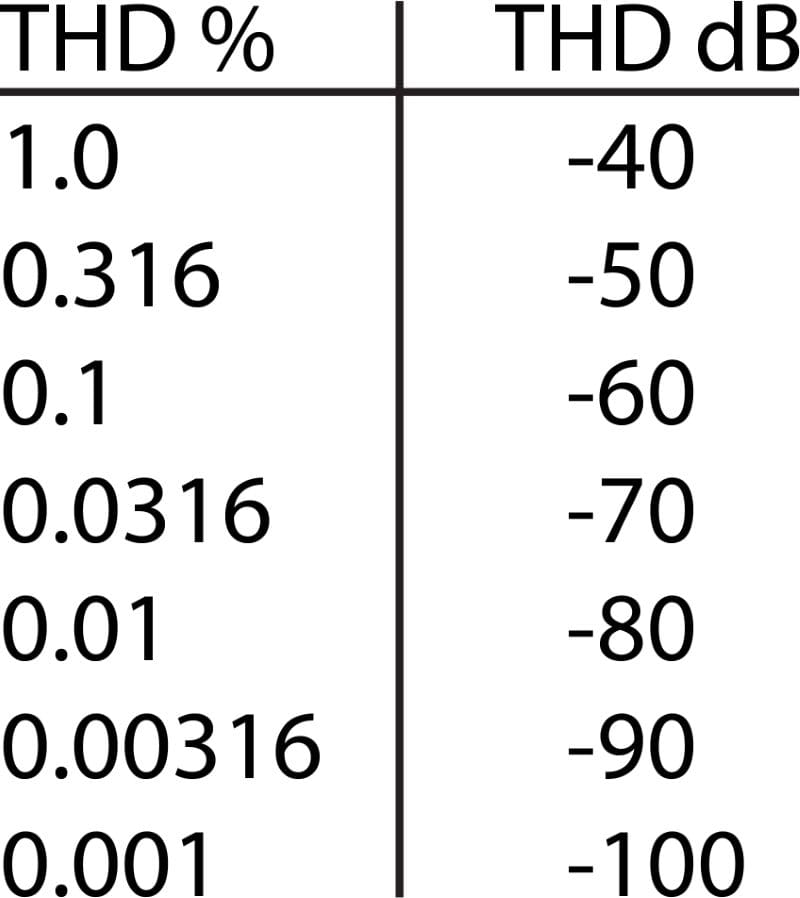
So, what are some common percentage THD+N numbers that tell us about the quality of an amplifier design? A distortion measurement of 1% THD+N is equal to -40 dB of harmonic distortion. We all know that this is pretty bad. A THD+N level of 0.316% is equal to -50 dB and 0.1% equals -60 dB of noise, both of which are pretty bad. A THD+N measurement of 0.01 is -80 dB, and is quite good. My reference level for acceptable THD+N from a product is about -70 dB, which is 0.0316%. If you see a number like that at 1 watt of output, then you should be in good shape. With that said, lower is better. Amplifiers that add less than 0.01% are excellent, in terms of design.
There are other factors to consider in choosing a great amplifier, such as frequency response, efficiency and processing features. As with any audio component, it’s impossible to “rate” the entire performance based on a single number. If you’re shopping for a car audio system upgrade, drop by a local specialty mobile enhancement retailer today and audition the options they have available for your vehicle.
