I recently had a discussion with several industry peers on Facebook about the correlation between audio component measurements and how that translates into subjective listening evaluations. Respectfully, I’m always astonished by the number of people who think distortion measurements don’t directly correlate to perceived product quality.
The Science of Car Audio Component Quality
Whether I’m testing a source unit, signal processor, amplifier, speaker or subwoofer, I’m trying to measure how accurately the device recreates, processes, amplifies or reproduces an audio signal. I’ve realized that many enthusiasts don’t understand that a discussion about distortion has nothing to do with a source unit or amplifier clipping. That’s overdriving something. Distortion is the addition of unwanted harmonic and intermodulation artifacts to the original signal. Distortion is added at ALL operating levels. In the case of source units and processors, it remains relatively constant at all levels. With amplifiers, especially Class A/B designs, distortion is more significant at lower levels. With speakers and subwoofers, distortion increases with drive level. The amount of distortion a product adds is the difference between a poorly designed or high-quality product.
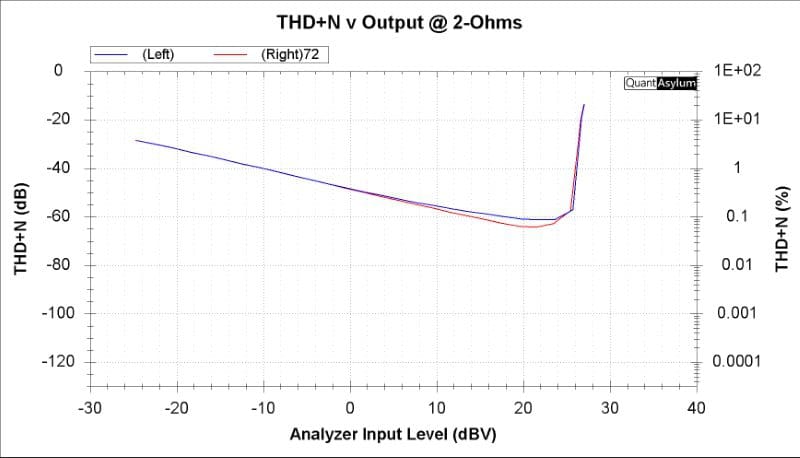
Unlike clipping, distortion is always there. It’s what makes different audio components sound different. For example, if I were to play a 100-hertz test tone through one amplifier and speaker and play that same track through a different amplifier and speaker, what I hear will sound different. Why? One amplifier might add a little third-order distortion, whereas the other might add more second-order harmonic content.
The same goes for the speakers – one might be very linear with respect to cone motion with a flat spider, a shorting ring in the motor and a copper sleeve on the T-yoke. The other driver might have a cupped spider, and neither of those distortion-reducing technologies and adds more harmonic distortion to the signal. Nonlinearities result in the cone not moving forward and rearward by the same amount. This nonlinear behavior adds harmonic distortion to the audio signal.
Let’s Look at How Electronic Components Add Distortion
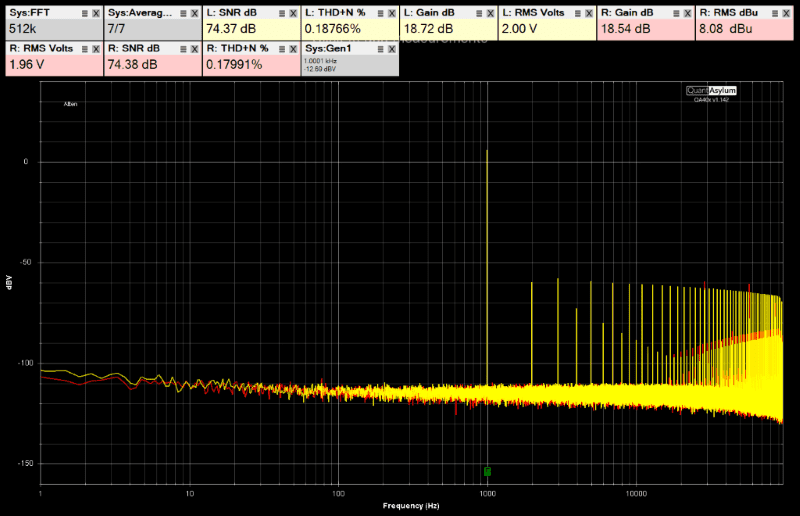
By way of example, let’s consider what might happen if I play a 100 Hz tone through several different amplifiers. The first amp might have a total harmonic distortion (THD) specification of 0.001% and add a third order harmonic at 300 Hz at a level of -100 dB from the fundamental signal. That’s pretty low and hard to hear. The second amp might have a THD specification of 0.01 % and add more second-order content, and then it would add a 200 Hz signal that’s 80 dB below the fundamental. If you’re listening at moderate volumes, this won’t stand out, but it does add something tangible to the experience that wasn’t in the original recording.
What makes distortion even more complicated is that it happens at all frequencies. If you listen to a recording of Neil Peart hitting the skin of a floor tom with a drumstick, you get a vast range of frequency content. Distortion happens to every frequency of what you hear. Something is added at every frequency’s second, third, fourth, fifth and sixth harmonics. You might not hear much beyond the fourth harmonic unless you have a very poorly designed audio component in the signal chain and are listening at high volume levels. With an amplifier that adds lots of distortion, the sound of the drumstick hitting the skin is blurred by unwanted information at multiples of every frequency.
Car Audio Component Clarity
The best way to describe how well an audio component reproduces or passes a signal is to describe its clarity. For example, I recently installed a Sony XAV-9500ES multimedia receiver in my wife’s 2019 Hyundai Santa Fe Essential. This radio is one of the best source units I have ever tested. I can hear a difference in the FM tuner’s clarity and how it plays 320 kbps MP3 files. I’m using the stock speakers and the amplifier built into the Sony radio. Nothing else has changed in the system, yet I can hear that everything is clearer. It’s clearer because less distortion is added to the audio signal.

Auditioning Audio Equipment
I mentioned in the original discussion that it was very easy to hear the difference between audio components with low and high distortion characteristics. I was immediately met with disbelief. I can tell you without hesitation that I don’t possess “golden ears.” My hearing is pretty average for a 50-year-old. I have the typical high-frequency roll-off above 13 kHz – all very normal. What I do have is extensive experience listening to the same songs on different audio systems. I’ve judged Autosound competitions and have formally reviewed hundreds of car audio products. To say that I’ve invested 1,000 hours into listening for the differences between these products would be an understatement. Based on this time investment in training, I am pretty good at quickly picking out the good and bad traits of an audio product or system. I’ve developed a very good mental picture of what the “best” I’ve ever heard is.
With that said, there are a few home speakers I’d still like to audition. So, I’m open to there being something better out there. This training is like any other physical activity – it takes years of practice to get good. It’s the same as training to play hockey, tennis or basketball.
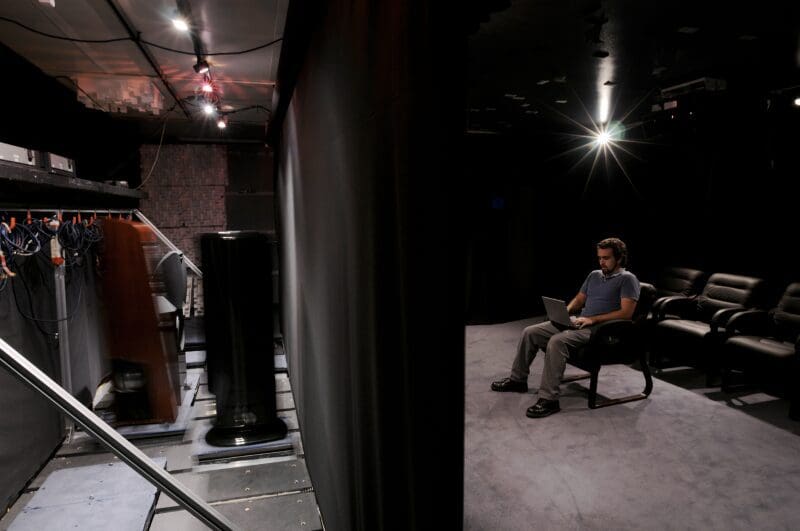
None of this means that I am any different from almost anyone else in hearing the difference between any two products. All you have to do is listen to them under controlled conditions. I’ve set up listening evaluations to compare amplifiers for groups of people on several occasions. All you need is a radio and a set of speakers. If you listen at a similar volume level, you’ll be able to pick out the differences between the amplifiers. It’s usually easiest to use a set of home speakers, as they offer wider bandwidth than most car audio speakers, but a nice set of 6×9 coaxial or 6.5-inch component speakers works well. Then, play part of a song, switch amplifiers and listen again.
Don’t listen to the lyrics or the notes the drummer or guitarist is playing. Instead, listen for the differences in what you hear between the amplifiers (or radios or speakers). Listen to the attack and decay of a stick hitting the skin on a drum. Listen to the balance of a female singer’s voice. Listen to the detail in a brush on a cymbal or the ring of a triangle. Go back and forth as often as you desire and play small bits of a track if you want. Listening to five or 10 seconds of a song reveals much more than listening to an entire song and then making the change. If you’re handy and have some basic wiring skills, you can make a speaker switcher with four SPDT relays and a small power supply.
I would suggest starting your listening comparison with two very different products. An inexpensive Class D amplifier versus a high-end Class A/B will likely be most dramatic. Likewise, you can choose an entry-level source unit and something high-end. Speakers and subwoofers are just as easy to compare. One tip: Try to balance the volume levels between the two subjects as closely as possible.
Build a Simple Source Switcher
If you want to switch back and forth between two amplifiers or two sets of speakers, build yourself a simple source switcher with four SPDT relays.
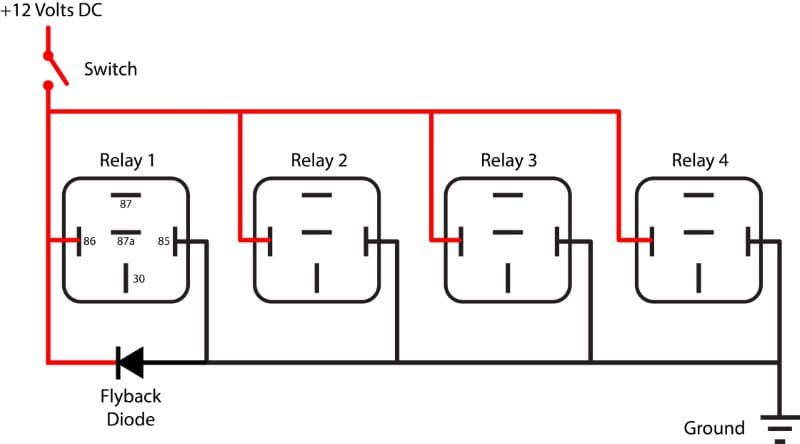
If you want to switch between the output of two amplifiers, connect the speakers to the 30 terminals on the relays, one amplifier to the 87a terminals and the other four to the 87 terminals. You’ll hear the amp connected to the 87a terminals when the control switch is off. You’ll hear the amp connected to the 87 terminals when you turn the switch on.
Connect the amplifier to the 30 terminals if you want to switch speakers. Connect one set of speakers to the 87a terminals and the other set to 87 terminals.
Regarding specific connections, the left negative speaker wire should be on relay 1, the left positive on relay 2, the right negative on relay 3 and the right positive on relay 4. The actual arrangement doesn’t matter, but keep them the same all the time. You may want to add a 12-position terminal strip to make it easy to connect speaker and amplifier wires to the switcher.
What Made Me Fanatical about Amplifier Comparisons
I’ve discussed this before, but I’ll share it again as the context is perfect. I worked for a car audio distributor in Canada many years ago. We “carried” a line of high-end amplifiers. I use quotes on the word “carried” because we didn’t stock them – they were available by special order. Several clients and peers asked me what I thought of them. In each case, my answer was that I didn’t have an opinion because I hadn’t auditioned them. A friend in Alberta offered to let me borrow a four-channel model of these amplifiers to check out. I set it up in my lab and listened to a dozen songs. It was very easy to listen to. Everything it reproduced was nicely balanced. I enjoyed listening to it for about two hours.
As I was about to tidy up, I reminded myself that I should listen to my reference amplifier as I hadn’t made many listening comparisons recently. So I swapped in my amp and cued up the same tracks. The difference couldn’t have been more dramatic. A hammer on a kick drum went from a gentle “boomf” to a startling “whack.” The sense of space around each performer on the soundstage changed. It was as if I had gone from a slightly blurry photograph from a Polaroid camera to using a 40-megapixel Hasselblad. If you’ve seen the James Webb Space Telescope photos compared to those from the Hubble, the difference was similar. All the same pieces are in both experiences, but one is razor-sharp and crystal-clear while the other is slightly blurry. It seemed like there was something between the speakers and my ears with the sample amplifier, like a cloud or curtain that obscured some of the detail.
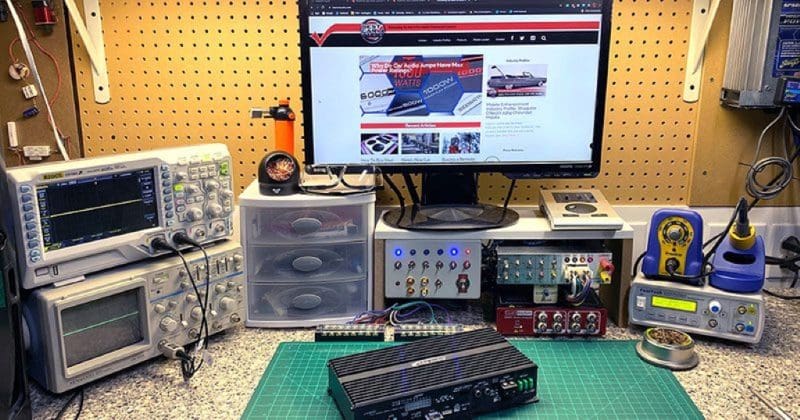
Sadly and frustratingly, at the time, I didn’t have the tools to measure both amplifiers to quantify these differences. Since I performed this comparison, and directly because of it, I have invested thousands of dollars in purchasing audio analysis equipment. I need to get that other amp back.
Correlating Measurements to Performance
So, was the first amp “bad”? No, not really. It was easy to listen to and presented an enjoyable experience. It was nice. My reference lab amplifier was, by comparison, violently analytical. Nothing from the first amp would startle me, even at high listening levels. The second amp startled me when a drumstick hit a snare. I love that clarity. I love the purity. Some describe this as having more control over a speaker. In reality, it’s just a case of the second amplifier adding less unwanted information to the presentation.
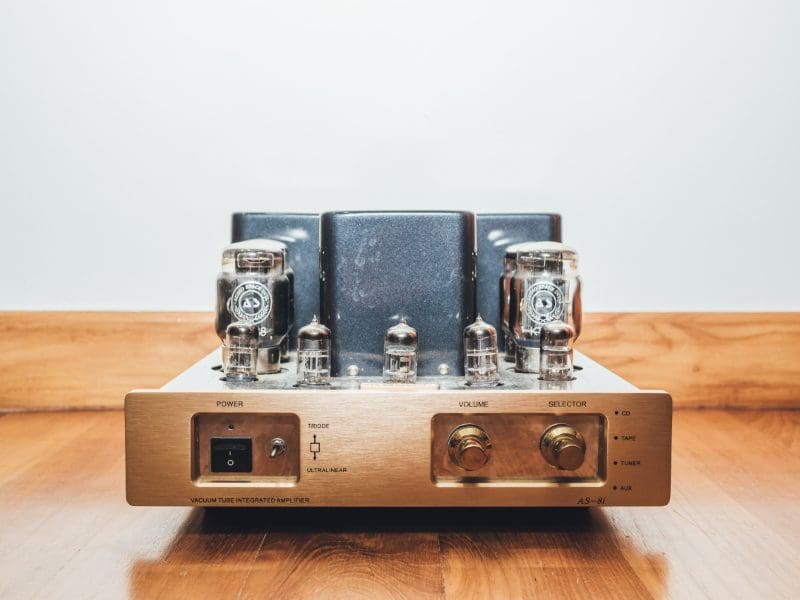
The difference is similar to what objective home audiophiles describe when comparing vacuum tube and solid-state amplifiers. I’ve auditioned several car audio tube amps with a similarly slow and soft sonic signature. They are pleasant to listen to, but what you hear isn’t an exact reproduction of the original recording. I can understand why people enjoy tube amplifiers. On the test bench, the distortion added by the tubes doesn’t measure well. So, it’s technically not “better,” but it is “nice.”
Here’s another way to think of the two. The first amp, or a tube amp, is akin to a painting of a field of flowers where the artist has taken liberties with the colors and sizing. The result might be a beautiful piece of art and may be very enjoyable to look at. My reference amp, on the other hand, is like a composite digital image that shows so much detail that you could count the petals and leaves on each flower. I’d be even happier if I could count the number of stamens in each flower. Because I correlate measurements to this clarity, I prefer the latter’s performance. Of course, some don’t, and that’s OK. As long as they don’t think it’s technically “better.”
One term that’s a red flag in all component evaluations is “warmth.” No amplifier, speaker or processor should sound like anything other than the signal sent to it. “Warmth” typically indicates a combination of harmonic distortion from bass frequencies and intermodulation distortion from upper frequencies that emphasizes the lower midrange region. This added information is what makes percussion seem soft or bloated. For example, midrange and midbass speakers with high Qts values (above 0.55) typically have a bump in the lower midrange between 100 and 300 hertz. They sound “warm” because the cone continues to resonate after the signal goes away. The same happens when a speaker or subwoofer is installed in an enclosure that’s too small.
Start Comparing Car Audio Components
Component comparisons don’t need to be fancy. Find a friend or two with some gear lying around and set up a listening session. Use a car battery or power supply to feed the radio and amp. Use a pair of home speakers. Switch back and forth between amplifiers and start to pick out the differences. Do the same with source units, speakers or signal processors. Borrow some high-end equipment if you can and listen to that.
In no time, you’ll start to develop a reference for what’s accurate. I’ll bet that reliable lab measurements of frequency response and distortion directly correlate to an improvement in what you perceive as “sound quality.”
