If you’re talking with car audio enthusiasts, mention of the word decibel instantly fires up a conversation of how loudly an audio system will play. But that’s just one of the ways we use decibels to compare levels in audio systems. This article will dive deep into the options to express values using decibel scaling.
What Is a Decibel?
Forget everything you think you know about decibels for a moment. In reality, a decibel isn’t anything on its own, except for a ratio of two numbers or values. In many instances, and with audio signals, it requires significant level changes to cause a perceivable difference. It doesn’t matter if we measure volume levels, voltages, watts or gain in an amplifier.
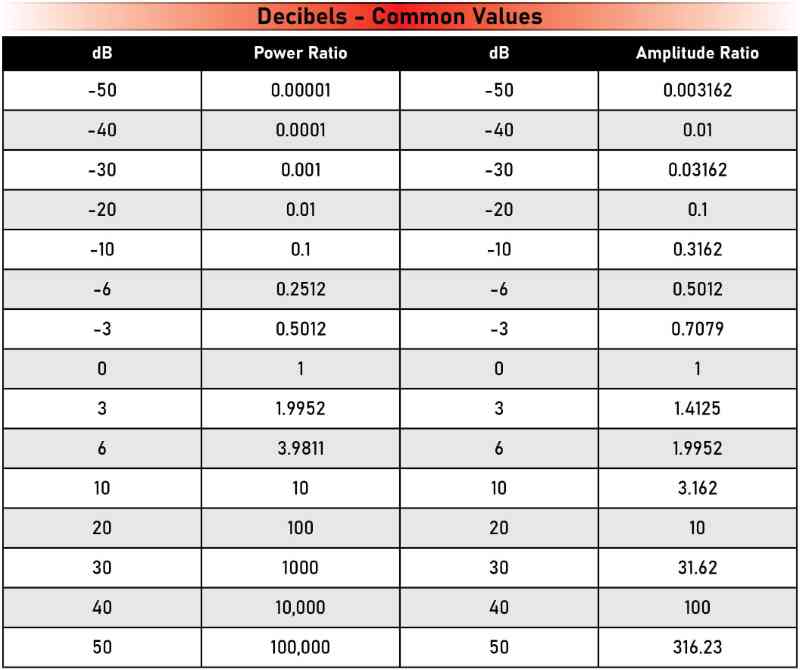
A decibel expresses a ratio between two numbers. For example, two measurements that differ by 1 decibel relative to power have one value that is 10 to the power of 1/10 greater than the other. If we are looking at an amplitude measurement like a voltage, then one value is 10 to the power of 1/20 greater or less than the other.
So, yes, the value changes whether we are talking about power ratios or amplitude ratios. Complicated, right? Not really, once you get used to it.
For power measurements, 10^(1/10) is 1.259825. For amplitude measurements, 10^(1/20) is 1.22018.
Many of us are used to hearing about 3 dB increases or decreases. If you plunk 3 into our decibel power equation of 10^(3/10), you get 1.995262, which is pretty close to 2. So, a 3-decibel increase in power is like a doubling of the power, or at least close enough. The other value you should know is 10 dB. Plugged into the equation of 10^(10/10), you get 10. So, a 10-decibel increase in power is 10 times as much power. A 20-decibel increase in power is 100 times, and a 30-decibel increase is 1,000 times.
Let’s look at relative levels in something such as a voltage reading. If we compare two voltages, and one is 3 dB more than the other, then we plug the value of 3 into our equation 10^(3/20) and get a factor of 1.412528. However, an increase of 6 dB results in something more familiar at 1.995252, a value we can round off to 2. If we compare one voltage to another where the second is double or half the first, we can say the difference is 6 decibels.
Sound Pressure Levels
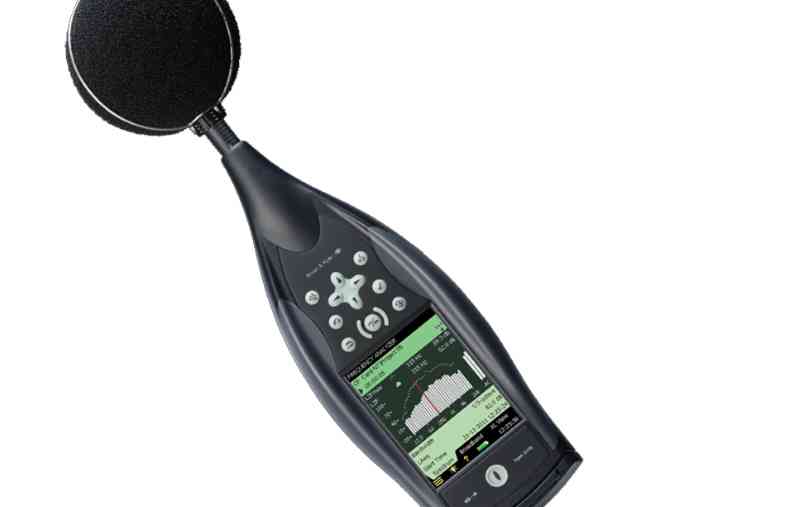
We’ll start with the most popular car audio application for the decibel: sound pressure levels, or SPL. When we talk about dB SPL, we compare a reading (using an SPL meter or real-time analyzer) of a sound to a level of 0 dB SPL. Zero dB SPL is the sound produced by a flying mosquito at a distance of 10 feet from the listener or microphone. Let’s be clear: Zero dB SPL is NOT absolute silence. If the mosquito were farther away, it would still produce sound, but it would be quieter. The farther away measurement might be -3 dB SPL or lower. A negative dB SPL measurement means there is still sound, but it’s quieter than our 0 dB reference.
When we talk about how loudly a car stereo can play or about the efficiency of a speaker, we use the units dB SPL because we’re referencing a measured level to our benchmark of 0 dB SPL. So why use the decibel scale? Well, 100 dB SPL is 10,000,000,000 times louder than that skeeter at 10 feet. So we’d rather write 100 dB than 10 billion.
Amplifier Wattage
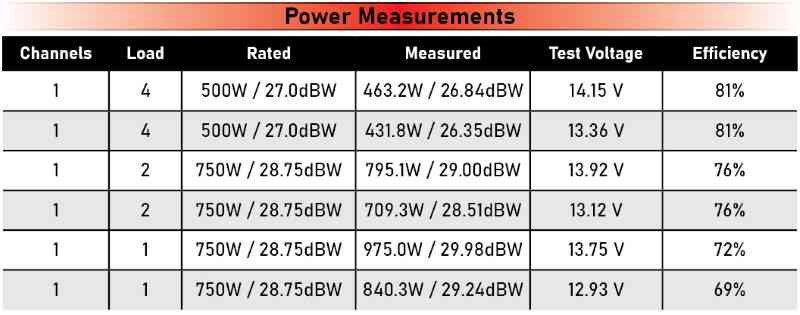
If you’ve read any of my Test Drive Reviews, you may have noticed that I include a value called dBW in the power measurements. The dBW value compares the amplifier or source unit’s measured output relative to 1 watt of power. So, if the amp produces 3 dBW, it creates 2 watts. If it’s 10 dBW, then it’s 10 watts. A level of 20 dBW is where things get interesting, as that equates to 100 watts of power. For example, a good-sized subwoofer amp might be 30 dBW or 1,000 watts.
This is an excellent way to describe amplifiers for two reasons. First, the values in dBW correlate to dB SPL, assuming the speaker or subwoofer system can operate linearly. If we look at the efficiency specification of a speaker that’s quantified using dB SPL@ 1W/1M, we can add 1 dB SPL for every dBW. An amp that can produce 15 dBW makes about 31.6 watts. If we have a speaker rated at 90 dB SPL at 1 watt, it should produce 105 dB SPL at 31.6 watts, or 15 dBW. Handy.
I also include the dBW values to highlight insignificant differences in measured and specified levels. For example, if an amp is rated to produce 60 watts of power, that’s 17.782 dBW. If the amp delivers 65 watts of power, we get a dBW equivalent of 18.129. That’s only 0.347 dB louder and is barely noticeable. The same thing happens if we go the other way – 55 watts is only 0.41 quieter than 60 watts. This is an excellent way to keep minor power level variations in check to determine whether they are worthy of consideration. It’s also important to remember that we need more power as things get louder. So, a 1,000-watt amp can is 30 dBW. However, if I test that amp and it produces 1,080 watts, that’s only 30.334 dB. You will never hear that extra 3/10 of a dB.
If you see a decibel value of dBm, they’re using 1 milliwatt as the reference.
Recording Levels
If we’re talking about setting amplifier sensitivity controls, I might refer to a signal recorded at 0 dB on a compact disc. In actuality, we’re referring to 0 dB FS or Full Scale. In the case of a digital recording, the loudest signal can be represented by 16 ones, and the lowest is 16 zeros. If something is recorded to reach this peak level, that’s the highest volume possible. The digital-to-analog converter will produce its maximum output without clipping. Assuming a source unit is designed properly and we have the volume turned up all the way, a 0 dB recording will produce the highest voltage on the preamp outputs. This might be 4 or 5 volts RMS on a good source unit.
It should be noted that there is no direct correlation between 0 dB FS among source units, other than to say that’s the max. So if you have an older radio that only produced 1.8 volts, then that’s all you get for your level-setting task.
Comparing Voltages
When I measure distortion and noise from an amplifier or source unit, my QA402 uses dBV units. These are decibels relative to 1 volt. Here’s where things get a touch tricky. I’ll fully admit that I often forget we’re talking about an amplitude ratio and not a power ratio. An increase of 6 dBV represents a doubling or halving of voltage. This applies to the input and output of the amplifier. If I feed an amp with 0 dBV, that’s a 1 volt RMS signal. A level of +6 dBV is 2 volts, and +12 dBV is 4 volts. The signal output on the QA402 tops out at +18 dBV, which is close to 8 volts RMS.
The output of the amplifier (or source unit or processor) is measured the same way – in dBV units. An output level of 20 dBV is 10 volts. Converting that number into a power reading requires plunking it into an equation with the load impedance. It’s simple to do, though: Square the voltage and divide by the load impedance to calculate the wattage. So, 10 times 10 is 100. Divide 100 by four, and you get 25 watts. If this were a subwoofer amp, we might have it driving a 2-ohm load, so we’d have 50 watts. Engineers and designers usually work in voltages rather than power levels.
An older unit that’s less common these days is the dBu. The analog level meters on an older mixing console might be labeled in dBu. When telephone systems were being developed, a load impedance of 600 ohms was typical for terminations on long signal cables. If 0.775 volt is applied across a load of 600 ohms, 1 milliwatt of energy is dissipated. In this application, 1 dBu was equal to 1 dBm. In short, 1 dBu is a voltage level referenced to 0.775 volt. A level of +6 dBV is equivalent to about 1.5465 volts. Yeah, I know, weird.
What About Weighted Measurements?
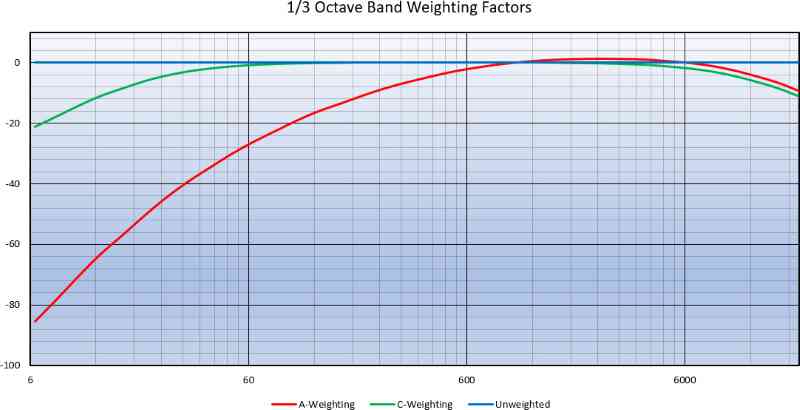
There are two commonly used weighting scales in audio measurements, the A and the C scale. These scales represent how the human ear perceives different frequencies. The study of this element of sound started in the early 1930s with the development of the Fletcher-Munson curve. That’s been superseded by the more accurate ISO 226:2003 standard for normal equal-loudness-level contours. In short, our ears are most sensitive to frequencies around 1kHz, and less so to higher and lower frequencies. The A-weighting curve reduces the importance of measurements on either side of 1 kHz. Using the C-weighting curve is similar at higher frequencies but doesn’t penalize low-frequency information as much. If you see a noise specification specified as 80 dB (A-weighted), then it might contain more noise than an equivalent measurement without any weighting.
Signal-to-Noise Ratios and Distortion Measurements
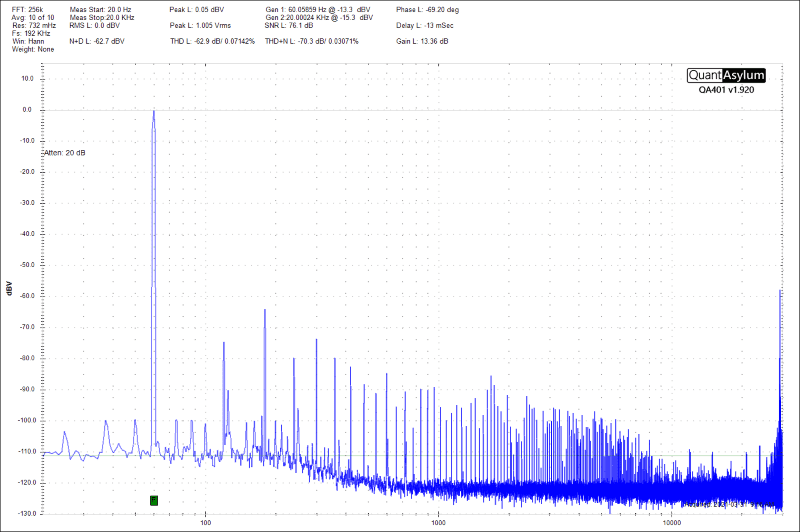
When I describe an amplifier or source unit as having a signal-to-noise ratio of -90 dB, the noise is 90 dB quieter than the test signal. A level of -90 dBV would describe the noise that’s 90 dB less than a 1-volt level. The same goes for distortion measurements. If an amp produces 1% distortion, then the sum of the harmonics is at a level of -40 dB relative to the test signal. We won’t get into the math for this calculation here; it’ll just give you a headache. Here are a few benchmark levels to keep mind, though: 0.1% is -60 dB, 0.01 is -80 dB and 0.001 is -100 dB. If you want a source unit, amplifier or processor that genuinely sounds good, something between -80 and -100 dB for harmonic distortion and noise is ideal.
Hopefully, this gives you a sense of how professionals in the car audio industry use the decibel scale to compare levels and provide information about the products available for your vehicle. Armed with this information, you’ll better understand the radio, speaker, amplifier or processor specs when shopping at your local specialty mobile enhancement retailer.
