Dozens of articles here on BestCarAudio.com explain the concept of audio component distortion. More specifically, harmonic and intermodulation distortion represent the addition of unwanted information to an audio signal because of non-linearities in an electronic circuit or mechanical system like a speaker. Ask anyone who’s heard a genuinely high-end sound system and they’ll tell you that even at dangerously high volume levels, they don’t “sound loud.” So let’s look at the correlation between distortion and perceived volumes.
A Home Audio Preface
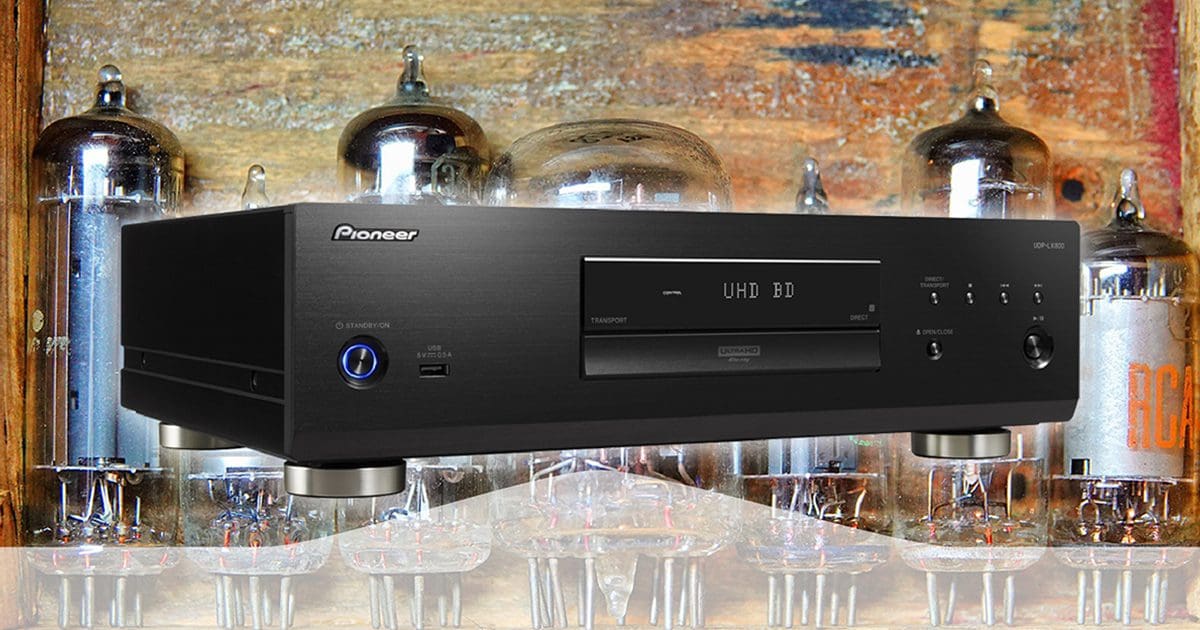
A few years ago, I was asked to measure the output of a high-end Pioneer home audio DVD player. The owner had sent the player to a company in the United States that purported to improve the product’s performance by adding vacuum tubes to the audio output section to replace solid-state operational amplifiers (op-amps). Even before the product arrived at my lab, I asked the client why in the world he’d make such a modification. He answered that he was told the unit would “sound better.” Someone lied to him.
His primary complaint about the modified DVD player (which he used as a CD player) was that midrange frequencies sounded louder. So I proposed three tests to quantify the characteristics of the modified player. The first was to measure the unit’s frequency response. Then I proposed two distortion analysis tests: one for harmonics and the second for intermodulation distortion. He agreed and sent me the modified player and a second unit that came straight from the factory without modifications.
Frequency Response Measurements
It took some experimentation, but I figured out how to make “offline” frequency response measurements of an audio device. In most testing, radios are treated like an amplifier. First, a test signal is fed into the auxiliary input, then the output of the device is measured by the analyzer. Unfortunately, this measurement includes the response and distortion characteristics of the auxiliary input circuitry and any analog-to-digital converter that might be in the signal path. My test can be done directly from a compact disc or USB memory stick and only shows the characteristics of the processing and output stage, just as though you were listening to music.
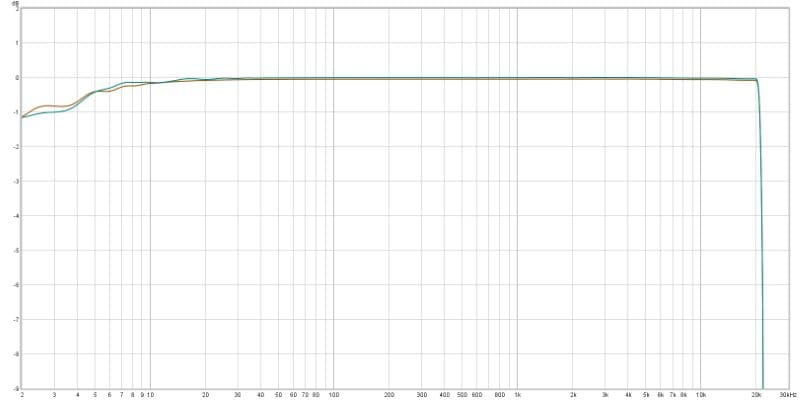
The otherwise original player offered very linear frequency response that extended from well below 10 Hz right up to 22 kHz with -1 dB limits.
The modified player exhibited significantly more low-frequency attenuation and some boost at the highest frequencies. The -1 dB point on the bottom end was just below 15 Hz, and there was a 0.5 dB boost at 20 kHz. The latter likely wouldn’t be very audible.
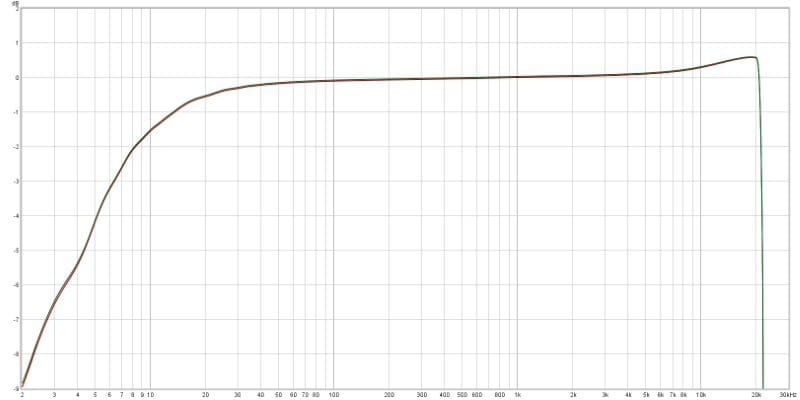
The takeaway is that the response was effectively equal through the midrange, playing a sine sweep. So, what was the cause of the perceived increase in midrange content?
Harmonic Distortion Measurement
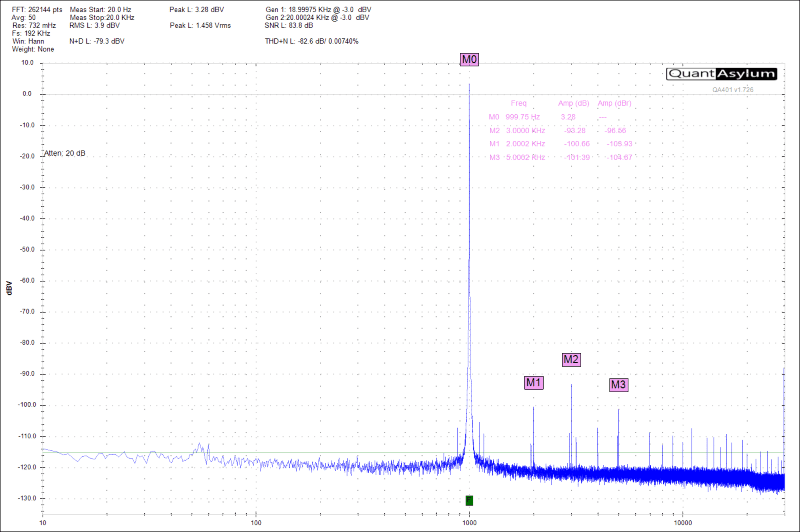
The next test was to play a 1-kHz test tone on both units and analyze the frequency content of the signal produced by each player. Starting with the unmodified Pioneer unit, it added a second harmonic at a level of -96.56 dB relative to the fundamental, a third harmonic at -103.93 dBr and a fourth harmonic at -104.67 dBr. The cumulative sum of all the harmonics and the noise floor adds to -82.6 dB, or 0.0074% THD+N. This is a very good performance for a source unit.
I played the same tone through the modified DVD player and was instantly presented with an explanation of why the two units sounded so different. The second harmonic was at a level of -84.3 dBr, the third at -68.72 dBr and the fourth at -81.41. Those harmonics, combined with the noise floor, add to a level of -68.1 dB, which equates to 0.0395% THD+N. This level of distortion would be considered normal for an inexpensive consumer-grade product, as you’d find at a big box store. It’s not atrocious, but not impressive.
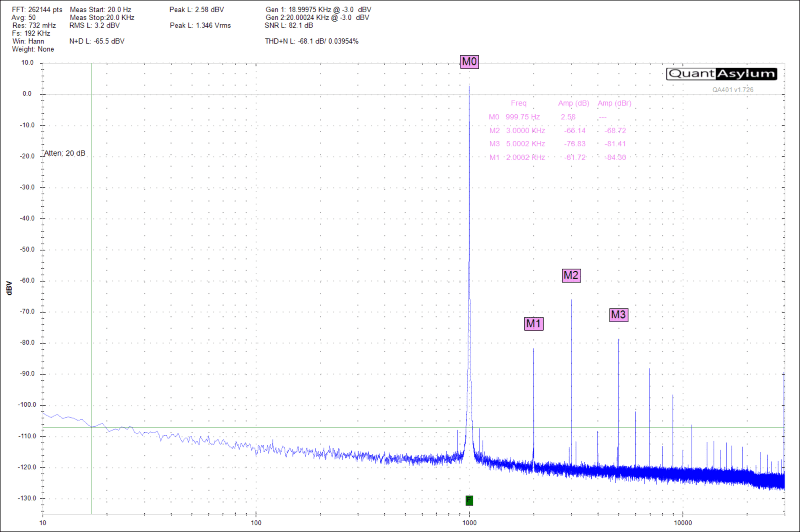
So, what does this mean in terms of listening to music? The decision to base distortion measurements on a percentage is very misleading. People think that a small number of 0.0395% is insignificant. In the grand scheme of things, it is, but not in the world of high-end audio. What matters more is the notation of the distortion being at -68.1 dB. Whenever a sound is reproduced by the player, harmonics of each frequency are added such that they are -68 dB below the fundamental. As I’ve mentioned in the past, it’s as if a group of unwanted backup signers has made their way onstage and are quietly adding in- and out-of-tune backup vocals to a song. If you listen to your music at 100 dB SPL, the unwanted distortion is at 30 dB. At least, that’s the basic concept. With the unmodified player, those singers are there, but they are now at 17 dB SPL. This makes them much harder to hear, so the original recording is more precise and better defined. Yes, this is how harmonic distortion works.
Intermodulation Distortion Analysis
The harmonic distortion analysis explains some of the extra perceived energy in the midrange and upper frequencies. More unwanted frequency content is added by the non-linearities in the vacuum tubes. A more difficult concept to grasp is intermodulation distortion. When two tones are played, many audio components (amplifiers, processors and speakers) will create a lower-amplitude clone of the signal at a frequency that’s the difference between the two fundamental frequencies. If someone is singing a note at 300 Hz and someone else is singing at 400 Hz, then a device with poor intermodulation distortion (IMD) characteristics will add output at 100 Hz. One hundred hertz is the difference between 300 and 400 Hz. The device will also add content at 100, 200, 300 and 400 hertz on either side of the fundamental frequencies. The first distortion at 100 Hz is called the Product. The distortions on either side of the fundamentals spaced apart by the Product frequency are called sidebands.
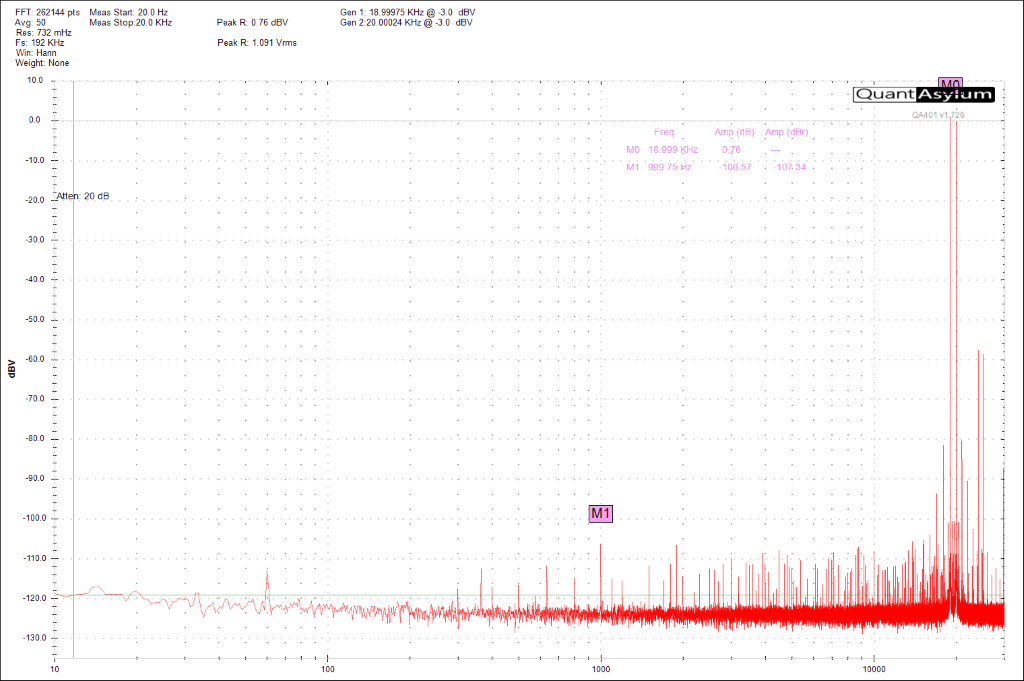
The industry-reference test for IMD involves playing two test tones at the same level. The tones are at 19 and 20 kHz. The difference between 19 and 20 kHz is 1 kHz. Therefore, the sideband distortion will appear at 18, 17, 16 and 15 kHz on the low side and 21, 22, 23 and 24 kHz on the high side. In short, it becomes a mess.
The unmodified Pioneer player created a product distortion at a level of -107.34 dBr, which is quite good. But, unfortunately, the 18 kHz sideband was at about -82 dBr, and the 21 kHz was at about -80.
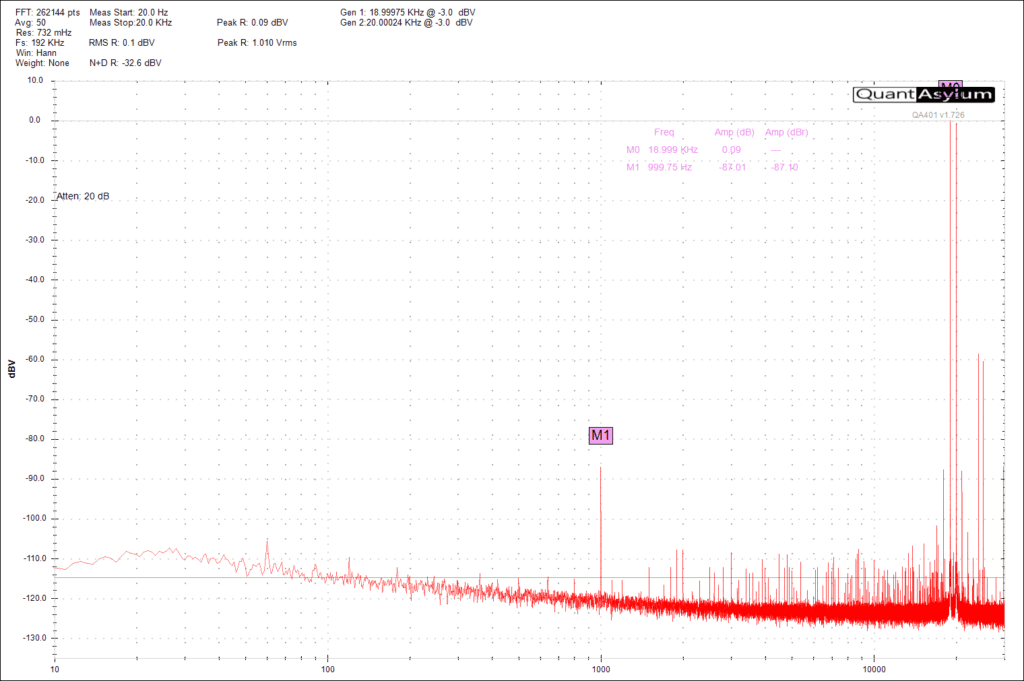
The modified player was different in its IMD characteristics. The Product distortion was about 5 dB louder at -87 dB, but the sidebands were lower at -87 and -88 dBr. In short, the vacuum tubes added more unwanted midrange information, while the solid-state solution added more high-frequency information – at least, in this case.
Distortion Adds Unwanted Output
Well, there you have it. A simple technical analysis of an audio product demonstrates how measurements correlate with its perceived performance. There are very few, if any, characteristics of a product that can’t be quantified through measurement. It’s a shame that those companies that produce amazing car audio solutions don’t share more information like this. So, if you’re searching for a source unit, amplifier, speaker or subwoofer that sounds genuinely amazing and clear, drop by a local specialty mobile enhancement retailer and audition what they offer.
