We’ve recently seen a resurfacing of keyboard commandos who claim that the ability to hear the differences between the amplifiers is hogwash. Those who have been around the car audio scene for a while often bring up Richard Clark’s famous $10,000 Amplifier Challenge to support their hypothesis that all amplifiers sound the same. If true, why do companies offer different amplifiers with the same power production capabilities? Wouldn’t one do? This article kicks off a series that explains why and how amplifiers can sound different. let’s start with looking at frequency response.
The Weakest Link in the Audio Quality Food Chain
Before discussing amplifiers, we should clarify that they are far from the top of the audio quality food chain. Speakers are exponentially more important in determining the performance of an audio system. For this explanation, let’s look at high-end home speakers, as they cover the complete audio spectrum. Car audio speakers are similar, but we’re much more likely to need a subwoofer to cover the bottom few octaves. Adding a subwoofer brings up the topic of system configuration and calibration, making the entire discussion more complicated.
Looking at the reviews of allegedly high-quality speakers, frequency response measurements can vary dramatically. One speaker might produce more bass than another, while a third might exhibit some high-frequency roll-off. Speakers that use many drivers may show dips or peaks around the crossover point. These issues play a huge role in determining what our music sounds like.
While keeping specifics about frequency response in mind, we’ll add that speakers are notoriously non-linear. At low volumes, even inexpensive designs might sound reasonable. With even moderate output increases, driver excursion becomes a significant issue, and both harmonic and intermodulation distortion can skyrocket.
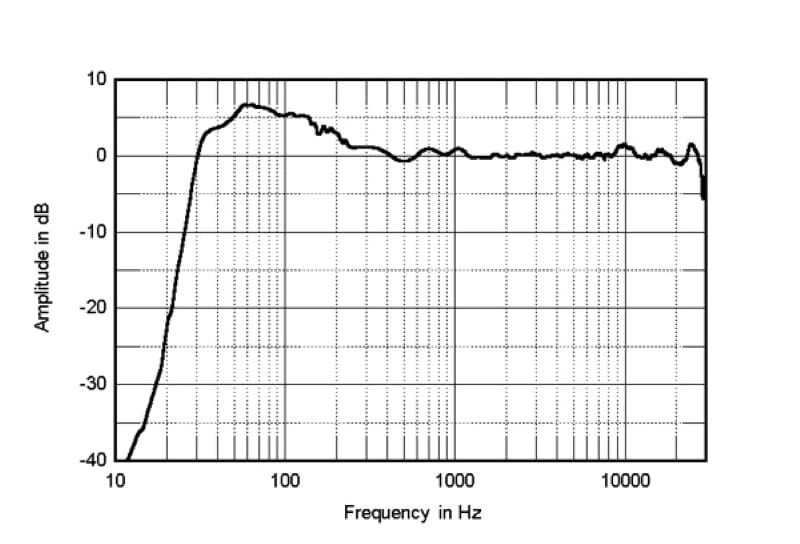
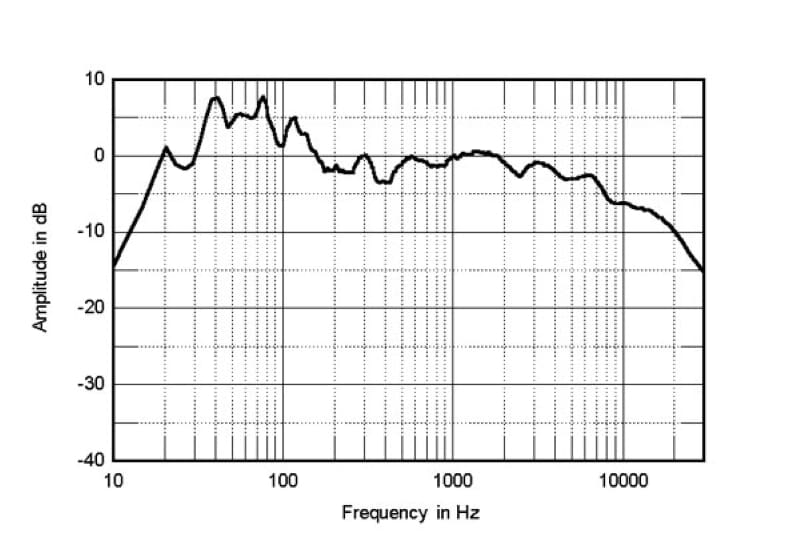
Look at the two frequency response graphs for a pair of high-end home speakers. The Kef speaker is ruler-flat from the upper midrange to beyond the limits of human hearing. The other speaker has dips and peaks throughout its operating range. Remember this as we work through the factors affecting perceived amplifier quality. Speakers are WAY more important.
What Is the $10,000 Amplifier Challenge?
Without getting into the specifics, Richard Clark, who used to compete in car audio competitions in the ’80s and ’90s, set out a challenge to compare two amplifiers. If I recall correctly, the two amplifiers would be equalized so that their output was identical when driving the chosen speakers. The test would require that the person listen to music on the two amplifiers through conventional moving-coil speakers and would have to pick one amp from the other in a blind test, based on the listening alone 12 out of 12 times. If they could do this successfully, Richard would give them $10,000.
What Should an Amplifier Do?
The perfect amplifier should take an audio signal from a source unit and increase that signal in amplitude while providing adequate current delivery to power a loudspeaker. The perfect amplifier wouldn’t add noise, change frequency response or affect anything in the time domain. However, the perfect amplifier doesn’t exist.
Amplifier Frequency Response
The frequency response of an amplifier describes how much gain it applies to different frequencies. The perfect amplifier should amplify any signal it receives equally at all frequencies. As a generalization, they usually do well, but they aren’t perfect.
The graph below shows the frequency response of an excellent quality Class D amplifier with its outputs connected to our large bank of load resistors.
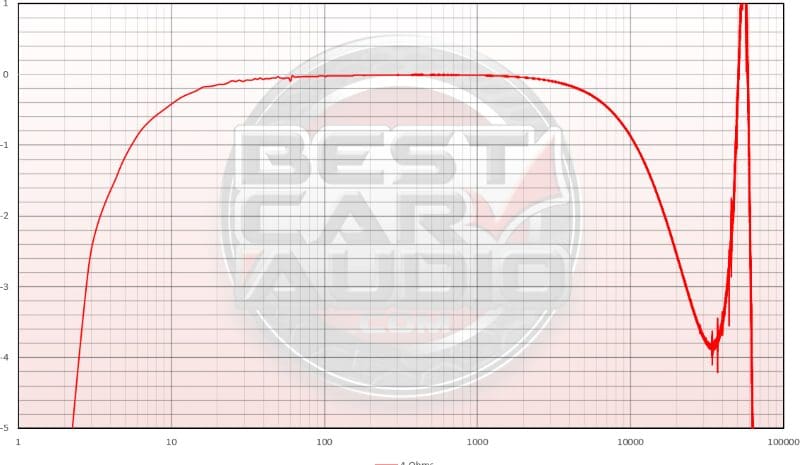
As you can see, the response is very smooth from the -3 dB frequency of about 2.8 hertz on the bottom to 23 kHz on the top. For a modern Class D amplifier, this is excellent performance. However, this entire series of articles will focus on us being as picky as possible. So, let’s look at the frequency response limits with a 1 dB tolerance. We now have a -1 dB frequency of 5.5 Hz on the bottom, and the top is -1 dB at about 11 kHz.
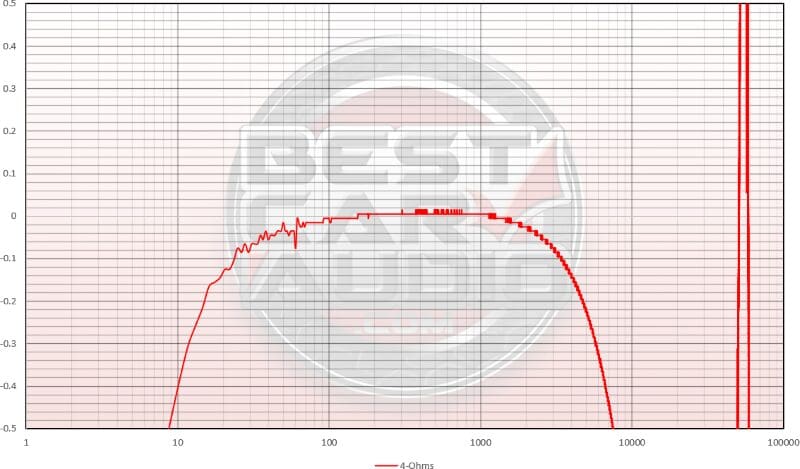
Let’s get even pickier, shall we? Here is the measurement again, but with a total of 1 dB between the top and bottom of the chart. The amp is still very flat through the midrange and down into the bass region.
Now, let’s switch to an entirely different amplifier design. We use an ARC Audio SE 2300 two-channel in the listening room as our reference amplifier. The SE 2300 is a high-bias Class AB amplifier rated to produce 330 watts per channel into a 4-ohm load. Into 2 ohms, it can deliver a speaker-melting 500 watts per channel. The phrase “high bias” denotes that the amplifier operates in more of a Class A mode at low output levels. This configuration helps reduce crossover distortion.
Let’s look at the frequency response of the SE 2300 when connected to a 4-ohm load and compare that to the Class D amp.
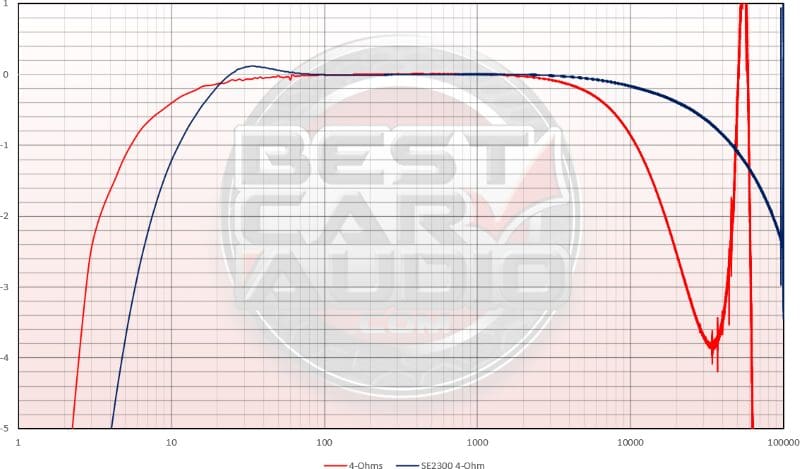
The SE2300 doesn’t play as low as the Class D amp, though a -3 dB frequency of 6 hertz is more than acceptable. We can also see a tiny bump in the response of 0.05 at 30 hertz. Given its low frequency, this bump is small and likely wouldn’t stand out as audible. On the top end, high-frequency extension is significant, with the -3 dB frequency being beyond the 96 kHz upper sampling limit of the analyzer. That’s pretty impressive. By comparison, the SE2300 is up 2.1 dB at 10 kHz and down 1 dB at 10 Hz. Is this an earth-shattering difference? Absolutely not.
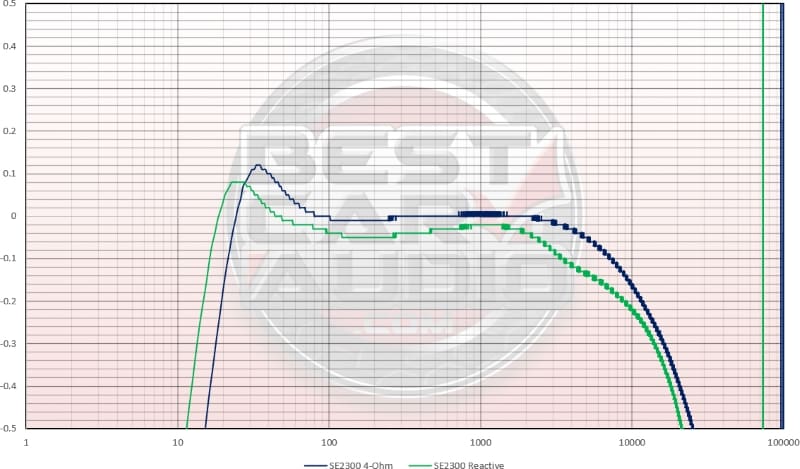
Let’s zoom in on the graph so we have 1 dB of range from top to bottom and add the simulated reactive load to the chart.
We can see that the change in load impedance has reduced the output by about 0.05 dB across the board, though it’s at a minimum amount around 1 kHz. The small peak in the bass is now lower in frequency and centered at 25 hertz. There’s also a tiny bit of high-frequency attenuation centered around 4 kHz. Keep in mind that it’s less than 0.1 dB in total.
Small Frequency Response Changes are Audible
The last chart we’ll look at compares the reactive frequency response of the two amplifiers. The SE2300 is green, and the Class D amp is yellow.
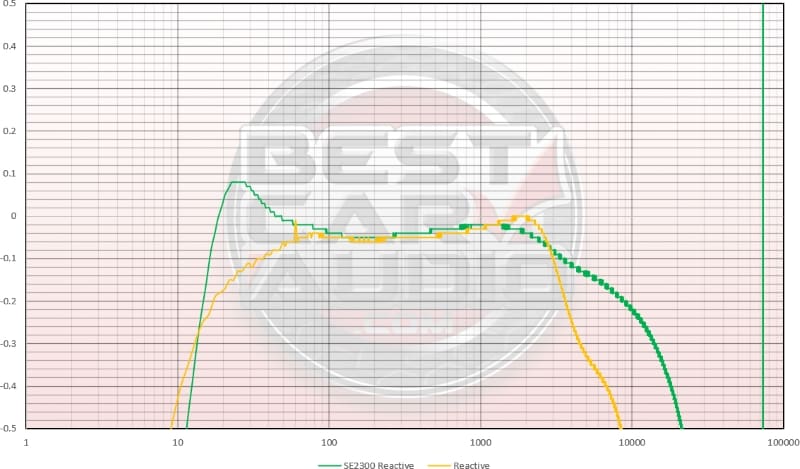
Measuring amplifier frequency response when driving load resistors doesn’t produce the same effective frequency response as driving reactive loads. The Class D amp is down 0.2 dB at 25 Hz and 0.2 dB at 10 kHz. I doubt the bass difference would be audible, but there would be a difference in the higher-frequency performance.
The net frequency response will also change significantly depending on the speakers connected to the amplifier. If you read magazines like Stereophile, you’ll find they try different speakers with their amplifier reviews and different amplifiers with their speaker reviews. The two components work together to determine the net system response.
So, will two high-quality amplifiers driving the same speaker sound similar? They will. Will they sound identical? Absolutely not.
To return to Richard Clark’s $10,000 Amplifier Challenge, would equalizing the output of the two amplifiers to produce the same frequency response make them more similar? It definitely would. Could you pick one amp from another correctly 12 out of 12 times? Likely not. Even without equalization, picking one amp from another 12 times in 12 tries using music would be very difficult. Does that mean all amplifiers sound the same? Once again, absolutely not.
The next article in this series on amplifier differences deals with noise and how it effects the perfection of quality. Until then, drop by a local specialty mobile enhancement retailer and listen to a few different amplifiers. We think you’ll find the performance characteristics to be quite diverse.
More From Our “Amplifier Differences” Series
- Part 1: Frequency Response explores how amplifiers handle different frequencies and how this affects the sound. It discusses the ideal of uniform amplification across all frequencies and examines how real-world amplifiers compare, using specific models for illustration.
- Part 2: Noise delves into the noise that amplifiers can add to the audio signal, how it’s measured, and its impact on sound quality. It explains the signal-to-noise ratio and how different amplifiers manage noise, including the effect of amplifier size on noise performance.
- Part 3: Harmonic Distortion discusses the concept of harmonic distortion, how it affects sound quality, and the performance of different amplifiers in minimizing it. It also touches on the distinction between even- and odd-order harmonics.
- Part 4: Distortion Versus Power Level and Frequency examines how distortion levels in amplifiers change with power levels and frequencies, highlighting the differences between high-quality and low-quality amplifiers in handling distortion.
- Part 5: Intermodulation Distortion focuses on intermodulation distortion, how it’s measured, and its effect on sound quality. It contrasts the performance of different amplifiers in managing IMD.
- Part 6: Car Audio Amplifier Crosstalk addresses how crosstalk between channels in an amplifier can affect the stereo imaging and soundstage of car audio systems, impacting the overall listening experience.
